Logging, Fishing, And Roofing Rank Among America's Deadliest Jobs
Logging remains one of the most dangerous ways to make a living in America. Workers in the occupation recorded a fatality rate of 110.4 deaths per 100,000 workers in 2024, more than 33 times the nationwide occupational fatality rate of 3.3.
Author:K. N.Sep 25, 20260 Shares62 Views
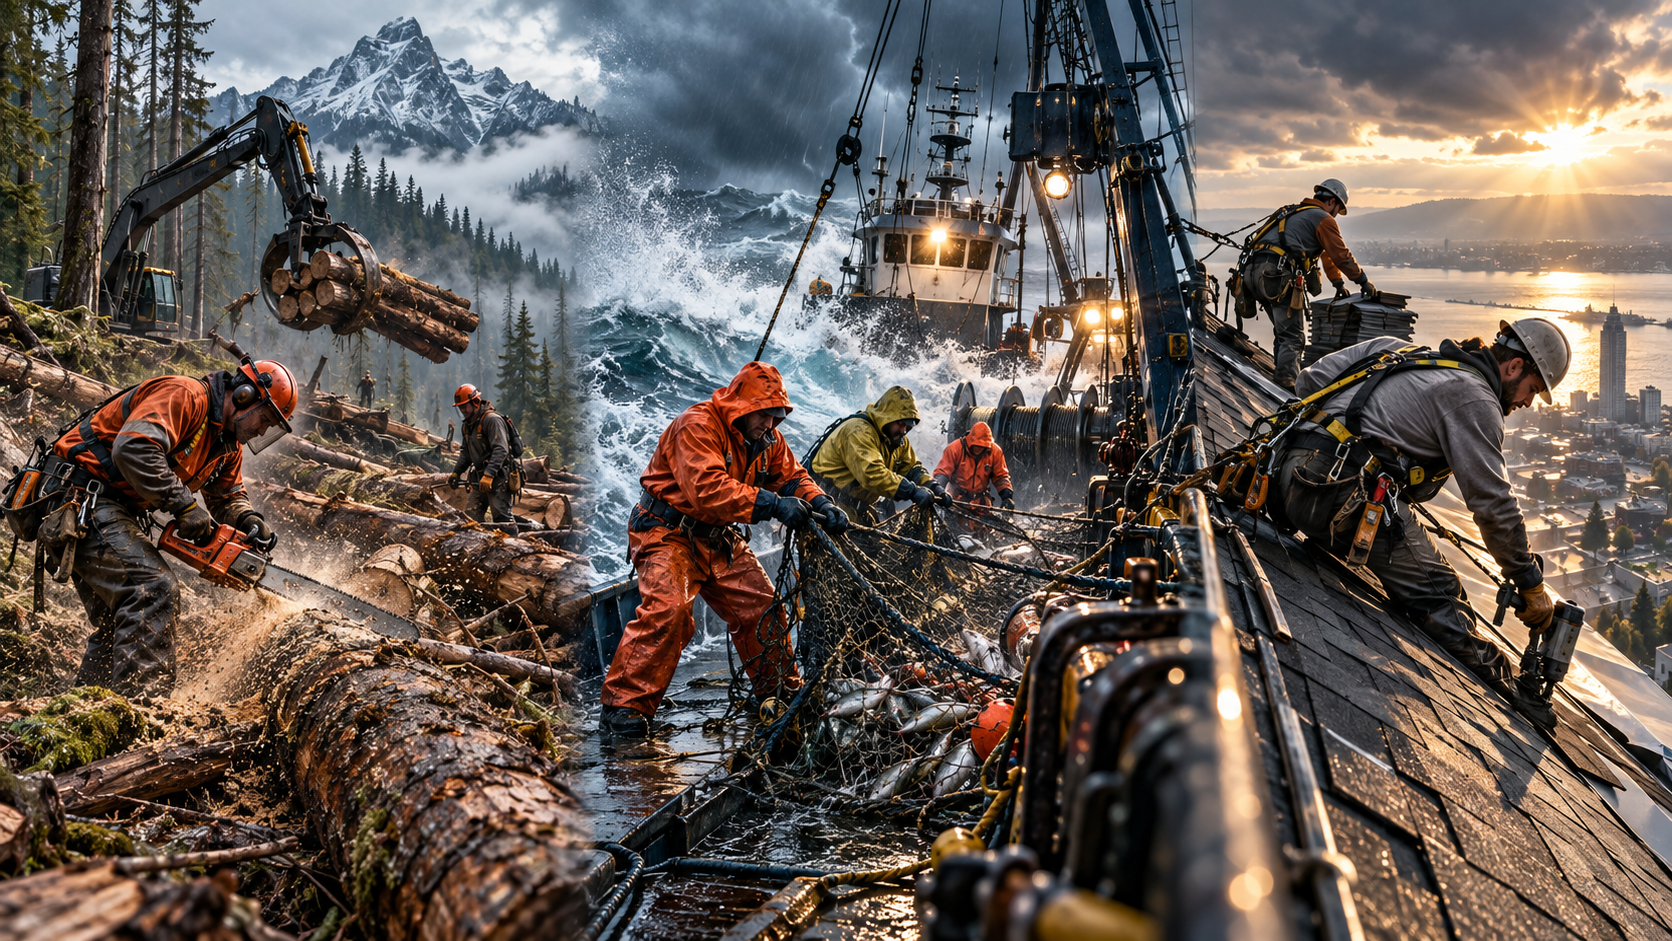
Logging remains one of the most dangerous ways to make a living in America.
Workers in the occupation recorded a fatality rate of 110.4 deaths per 100,000 workers in 2024, more than 33 times the nationwide occupational fatality rate of 3.3. Fishing and hunting workers faced the second-highest rate among occupations analyzed at 88.8 deaths per 100,000, while roofers ranked among the most dangerous at 48.7.
Those figures are part of a broader workplace-safety analysis from Anidjar & Levine, which examined both occupation-level hazards and state-by-state risk to identify where and how Americans face the greatest danger on the job.
The study finds that workplace risk is far from evenly distributed. Some occupations carry extraordinarily high fatality rates because workers routinely encounter heights, heavy machinery, transportation hazards or unpredictable environments. Meanwhile, jobs with lower individual fatality rates can account for far more deaths because the industries employ much larger numbers of Americans.
That distinction is particularly visible in trucking.
Driver/sales workers and truck drivers had a fatality rate of 25.7 per 100,000 workers, well below logging's 110.4. Yet the group recorded 950 worker deaths, making it the largest raw fatality total among occupations highlighted in the analysis.
America’s Highest-Risk Jobs
The most dangerous occupations are concentrated heavily in industries where workers spend significant time on roads, at heights, around machinery or in outdoor environments.
Occupation: Logging workers
- Fatality Rate per 100,000 Workers: 110.4
- Fatalities: 51
Occupation: Fishing and hunting workers
- Fatality Rate per 100,000 Workers: 88.8
- Fatalities: 24
Occupation: Roofers
- Fatality Rate per 100,000 Workers: 48.7
- Fatalities: 104
Occupation: Structural iron and steel workers
- Fatality Rate per 100,000 Workers: 37.8
- Fatalities: 14
Occupation: Refuse and recyclable-material collectors
- Fatality Rate per 100,000 Workers: 37.4
- Fatalities: 36
Occupation: Aircraft pilots and flight engineers
- Fatality Rate per 100,000 Workers: 36.7
- Fatalities: 73
Occupation: Construction trade workers
- Fatality Rate per 100,000 Workers: 35.8
- Fatalities: 18
Occupation: Underground mining machine operators
- Fatality Rate per 100,000 Workers: 35.6
- Fatalities: 12
The table highlights why both rates and totals matter when evaluating occupational safety.
Logging has the highest fatality rate but a relatively small workforce. Trucking, by contrast, has a lower rate but exposes far more workers to occupational hazards. Construction laborers illustrate the same effect: their fatality rate was 15.8 deaths per 100,000, but 334 construction laborers died on the job.
For an individual employee, the fatality rate offers a more useful comparison of occupational danger than raw deaths alone. For policymakers and employers considering the total national burden, however, the number of workers exposed can be equally consequential.
More Than 5,000 Americans Died On The Job In One Year
Across all occupations, the United States recorded 5,070 fatal workplace injuries in 2024, down from 5,283 in 2023.
The national fatality rate fell from 3.5 to 3.3 deaths per 100,000 full-time-equivalent workers, marking a second consecutive annual decline. Even with that improvement, a U.S. worker died from a work-related injury approximately every 104 minutes.
The causes of those deaths show that there is no single workplace hazard responsible for the national toll.
- Fatal Workplace Event: Transportation incidents; 2024 Deaths: 1,937
- Fatal Workplace Event: Falls, slips and trips; 2024 Deaths: 844
- Fatal Workplace Event: Contact incidents; 2024 Deaths: 756
- Fatal Workplace Event: Violent acts; 2024 Deaths: 733
- Fatal Workplace Event: Harmful substances or environments; 2024 Deaths: 687
- Fatal Workplace Event: Explosions and fires; 2024 Deaths: 93
Transportation alone accounted for 38.2% of all fatal occupational injuries, making it the country's largest workplace-fatality category.
Transportation Is The Largest Threat To American Workers
Roadway incidents caused 1,146 workplace deaths in 2024, but the transportation problem extends beyond employees driving cars or trucks.
Anidjar & Levine's analysis also identified:
- 369 fatal pedestrian incidents involving motor vehicles
- 109 deaths associated with aircraft incidents
- 61 pedestrian deaths in road-work zones
- 52 fatalities involving water vehicles
- 36 involving rail vehicles
Transportation and material-moving occupations collectively recorded 1,391 fatal work injuries in 2024, more than any other broad occupational group. That figure was down 7% from 1,495 deaths a year earlier, while the group's fatality rate fell from 13.6 to 12.5 per 100,000 workers.
The data help explain why truck driving remains one of the most consequential occupations in the workplace-safety discussion. Heavy and tractor-trailer truck drivers alone accounted for 798 occupational deaths in the data analyzed by Anidjar & Levine.
Falls Remain A Major Threat In Construction And Roofing
Falls, slips and trips caused another 844 worker deaths, making them the second-largest fatal-event category identified in the national data.
Most were falls to a lower level, which accounted for 666 deaths. Another 150 fatalities involved same-level falls, slips or trips.
Falls exceeding 30 feet represented 10.8% of all fatal falls, slips and trips.
The numbers are especially relevant to industries such as roofing and construction, where employees routinely work above ground level. Roofers recorded both one of the nation's highest occupational fatality rates and more than 100 worker deaths during the year analyzed.
The pattern is different but similarly serious for workers operating around machinery. Contact incidents killed 756 workers, including 357 who were struck by objects and 213 who were caught in or crushed by equipment.
Workplace Violence Accounts For Hundreds Of Deaths
Not every workplace death results from an accident.
Violent acts caused 733 occupational fatalities in 2024, according to the data included in the study. Workplace homicides accounted for 470 deaths, including 379 shootings. There were also 263 workplace suicides.
Harmful substances and environmental exposures caused another 687 deaths. Drug and alcohol overdoses accounted for 410, or 59.7%, of fatalities within that category.
There was some improvement: harmful-exposure deaths fell 16.2% from 820 in 2023, driven largely by a decline in fatal workplace overdoses from 512 to 410.
Wyoming Workers Face The Highest Overall State Risk
The nature of a person's job matters, but Anidjar & Levine's findings show geography matters as well.
The firm's Worker Risk Index combines current workplace fatality rates, five-year fatality rates, recent trends, employment in higher-risk occupations and self-employment exposure.
Wyoming ranks first nationally with a score of 99.4.
Rank 1: Wyoming
- Worker Risk Score: 99.4
- Current Fatality Rate: 13.9
Rank 2: Mississippi
- Worker Risk Score: 89.8
- Current Fatality Rate: 8.0
Rank 3: North Dakota
- Worker Risk Score: 84.7
- Current Fatality Rate: 6.8
Rank 4: Arkansas
- Worker Risk Score: 84.5
- Current Fatality Rate: 6.2
Rank 5: Montana
- Worker Risk Score: 84.5
- Current Fatality Rate: 5.8
Rank 6: Alaska
- Worker Risk Score: 80.8
- Current Fatality Rate: 7.1
Rank 7: Idaho
- Worker Risk Score: 80.6
- Current Fatality Rate: 5.0
Rank 8: West Virginia
- Worker Risk Score: 79.6
- Current Fatality Rate: 5.8
Rank 9: Iowa
- Worker Risk Score: 77.3
- Current Fatality Rate: 5.2
Rank 10: South Dakota
- Worker Risk Score: 74.7
- Current Fatality Rate: 5.8
Wyoming's fatality rate of 13.9 deaths per 100,000 workersis more than four times the U.S. average. Its five-year average of 13.2 also indicates that elevated occupational risk has persisted beyond a single year.
Mississippi ranks second overall with a current rate of 8.0, followed by North Dakota with 6.8.
High-Risk States Employ More People In Dangerous Occupations
One explanation for the geographic divide is the composition of state workforces.
Higher-risk jobs account for 24.05% of employment in the 10 states at the top of the Worker Risk Index, compared with 18.97% in the 10 lowest-risk states. That's a difference of more than five percentage points.
Wyoming again provides one of the clearest examples. Approximately 27.4% of workers are employed in higher-risk occupational categories, while construction and extraction jobs alone account for 8.98% of employment.
Transportation and material-moving jobs are the largest higher-risk occupational group in 47 states. In Wyoming, Montana and Vermont, construction and extraction instead make up the largest category.
Workforce makeup is not enough by itself to establish overall danger, however.
Nevada has one of the nation's highest modeled occupational-risk mixes, yet it ranks 29th overall because its current fatality rate is only 2.3 deaths per 100,000 workers. That demonstrates why the Anidjar & Levine index incorporates actual fatality data alongside employment structure.
The Lowest-Risk States Cluster In The Northeast
The opposite end of the ranking looks dramatically different.
New Jersey has the lowest Worker Risk Index score at 10.2, followed by New Hampshire, Massachusetts and Rhode Island.
State: New Jersey
- Worker Risk Score: 10.2
- 2024 Fatality Rate: 1.9
State: New Hampshire
- Worker Risk Score: 11.6
- 2024 Fatality Rate: 1.7
State: Massachusetts
- Worker Risk Score: 12.2
- 2024 Fatality Rate: 2.1
State: Rhode Island
- Worker Risk Score: 13.1
- 2024 Fatality Rate: 1.1
State: Delaware
- Worker Risk Score: 16.9
- 2024 Fatality Rate: 2.0
State: Connecticut
- Worker Risk Score: 20.2
- 2024 Fatality Rate: 2.3
State: New York
- Worker Risk Score: 21.8
- 2024 Fatality Rate: 2.4
State: Illinois
- Worker Risk Score: 25.7
- 2024 Fatality Rate: 2.7
State: Minnesota
- Worker Risk Score: 30.8
- 2024 Fatality Rate: 2.9
State: Oregon
- Worker Risk Score: 31.0
- 2024 Fatality Rate: 2.6
The difference is sizable. Workers in the 10 highest-risk states collectively experienced an average fatality rate of 6.96 per 100,000, compared with 2.17 among the 10 lowest-risk states.
That roughly threefold gap illustrates why national averages can hide large state-level disparities.
Workplace Injuries Extend Far Beyond Fatal Incidents
Deaths represent the most severe occupational outcome, but nonfatal injuries affect millions of workers as well.
Between 2023 and 2024, employers reported approximately 2.98 million cases involving days away from work, restricted work or job transfers, according to the data examined by Anidjar & Levine.
Major causes included:
- 946,290 cases involving overexertion, repetitive motion or other bodily reactions
- 860,050 contact incidents
- 721,720 falls, slips and trips
- 121,330 transportation incidents
Musculoskeletal disorders appeared in 484,620 cases involving time away from work, while sprains, strains and tears accounted for another 335,570 such cases.
Those numbers show why a state with relatively low fatality risk can still experience significant workplace-injury problems. Maine, for example, had one of the highest available total recordable injury and illness case rates but ranked only 21st on Anidjar & Levine's fatality-focused index.
Dangerous Work Does Not Necessarily Mean Better Pay
The study also found little evidence that workers in the riskiest parts of the country are consistently compensated more for that exposure.
Average wages across high-risk occupations were $53,846 in the 10 highest-risk states, compared with $58,467 in the 10 lowest-risk states, a difference of approximately 7.9%.
Among selected high-risk jobs, average wages included:
- Grounds maintenance workers: $40,080
- Construction laborers: $47,120
- Logging workers: $49,660
- Refuse collectors: $49,690
- Driver/sales workers and truck drivers: $50,390
- Roofers: $55,440
Pay is considerably higher in some specialized hazardous occupations. Aircraft pilots and flight engineers averaged about $210,020, while power-line installers averaged roughly $95,320.
The larger pattern, however, shows that a high fatality rate does not automatically come with a wage premium.
How Anidjar & Levine Ranked Worker Risk
The Worker Risk Index assigns the greatest importance to the most recently observed workplace fatality rate while also accounting for longer-term conditions.
- Component: Current fatality rate; Weight: 40%
- Component: Five-year average fatality rate; Weight: 20%
- Component: Higher-risk occupational mix; Weight: 20%
- Component: Recent fatality trend; Weight: 10%
- Component: Self-employment share; Weight: 10%
Each component was converted into a state-relative score before the weighted measures were combined.
The ranking therefore measures comparative workplace risk rather than predicting whether an individual employee will suffer an injury.
The broader picture from Anidjar & Levine's study is more complicated than identifying a single "most dangerous job." Logging and fishing stand out because of their extraordinary fatality rates. Trucking stands out because of the sheer number of workers killed. Construction and roofing remain heavily exposed to falls, while employees across multiple industries face transportation, machinery, violence and harmful-substance risks.
And location can compound those dangers. A worker in Wyoming is employed in a state with a workplace fatality rate more than four times the national figure, while employees in several Northeastern states experience rates well below the U.S. average.
Although workplace fatalities declined nationally in 2024, the latest figures still show 5,070 lives lost in a single year. The data indicate that progress at the national level has not eliminated the much larger risks faced by workers in certain occupations, industries and states.
Jump to
America’s Highest-Risk Jobs
More Than 5,000 Americans Died On The Job In One Year
Transportation Is The Largest Threat To American Workers
Falls Remain A Major Threat In Construction And Roofing
Workplace Violence Accounts For Hundreds Of Deaths
Wyoming Workers Face The Highest Overall State Risk
High-Risk States Employ More People In Dangerous Occupations
The Lowest-Risk States Cluster In The Northeast
Workplace Injuries Extend Far Beyond Fatal Incidents
Dangerous Work Does Not Necessarily Mean Better Pay
How Anidjar & Levine Ranked Worker Risk

K. N.
Author
Latest Articles
Popular Articles